Raymii.org

אֶשָּׂא עֵינַי אֶל־הֶהָרִים מֵאַיִן יָבֹא עֶזְרִֽי׃Home | About | All pages | Cluster Status | RSS Feed
My First Kubernetes: k3s 'cluster' on 3 Orange Pi Zero 3's, including the dashboard, hello-node and failover
Published: 28-06-2024 22:30 | Author: Remy van Elst | Text only version of this article
❗ This post is over one years old. It may no longer be up to date. Opinions may have changed.
Table of Contents
I've been working as an embedded C++ developer for over 5 years now so my sysadmin / devops skills are becoming a bit rusty. The odd bit of Ansible here and there but no new stuff. I figured it was time to expore Kubernetes, as it is what all the cool kids do these days. So I got myself 3 new SBC's, the Orange Pi Zero 3. I'll be using these to install and setup a basic Kubernetes cluster, getting the Dashboard working, installing a Hello World app and testing how the failover works.
Meet "The Cluster":
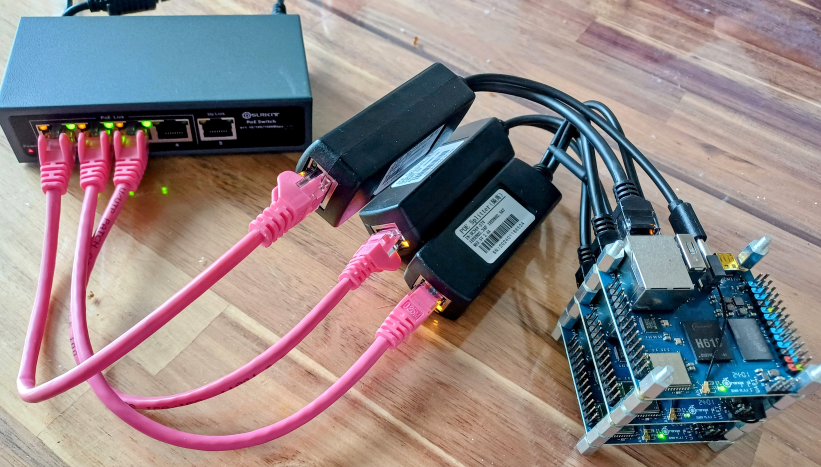
"The Cluster" consists out of the cheapest Power over Ethernet (PoE) switch I could find (EUR 30 on AliExpress), 3 Power over Ethernet to USB-C splitters and 3 Orange Pi Zero 3 computers with 4 GB of RAM and Gigabit Ethernet. I went with a PoE switch to reduce the mess of cables and adapters, which turned out to be quite small and okay. I put in some M3 standoffs between the Orange Pi boards and maybe I'll 3D-print another enclosure to tidy up the PoE splitters in the future. For now, it works quite well. The boards are booting without a Micro SD card since Kubernetes is so resource intensive, it would wear those cards out quickly.
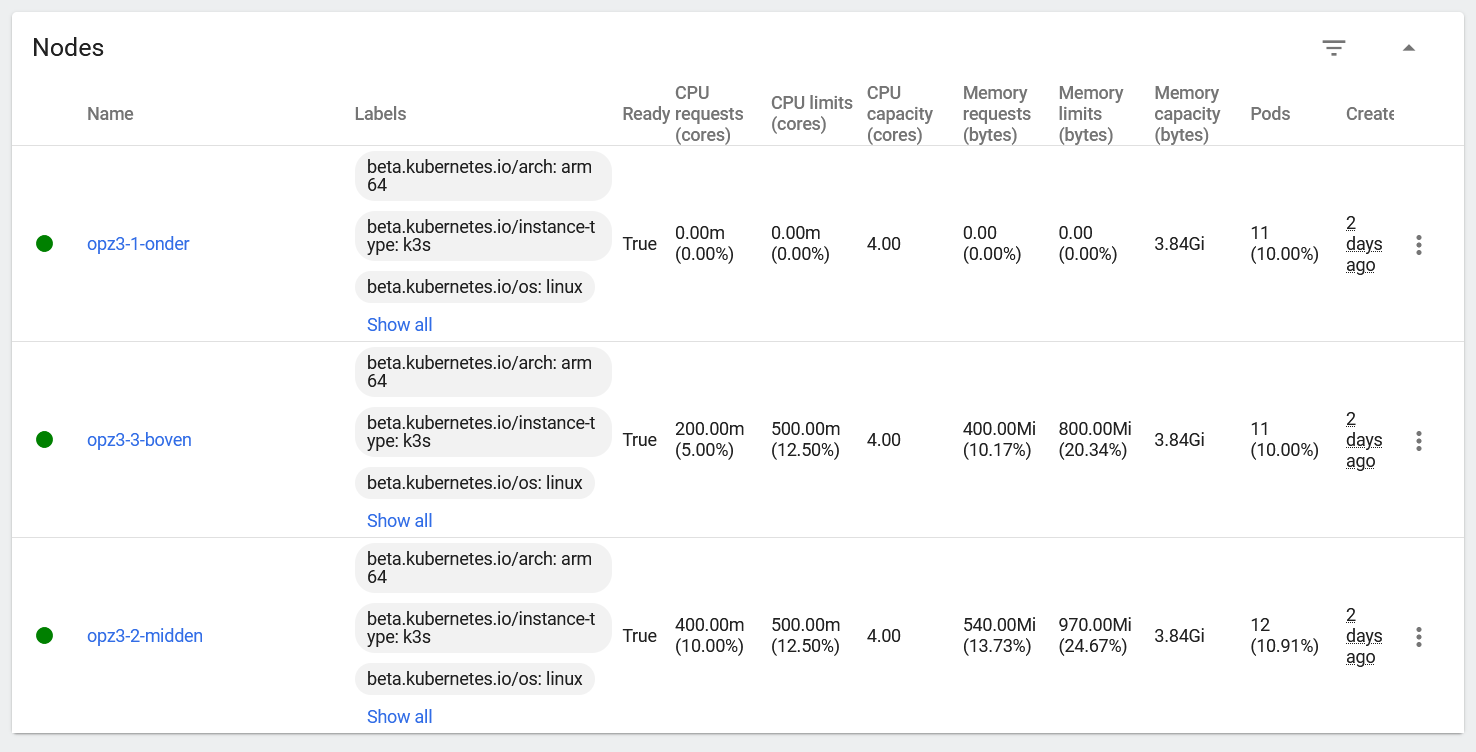
Here is the end result, 3 nodes in the Kubernetes Dashboard:
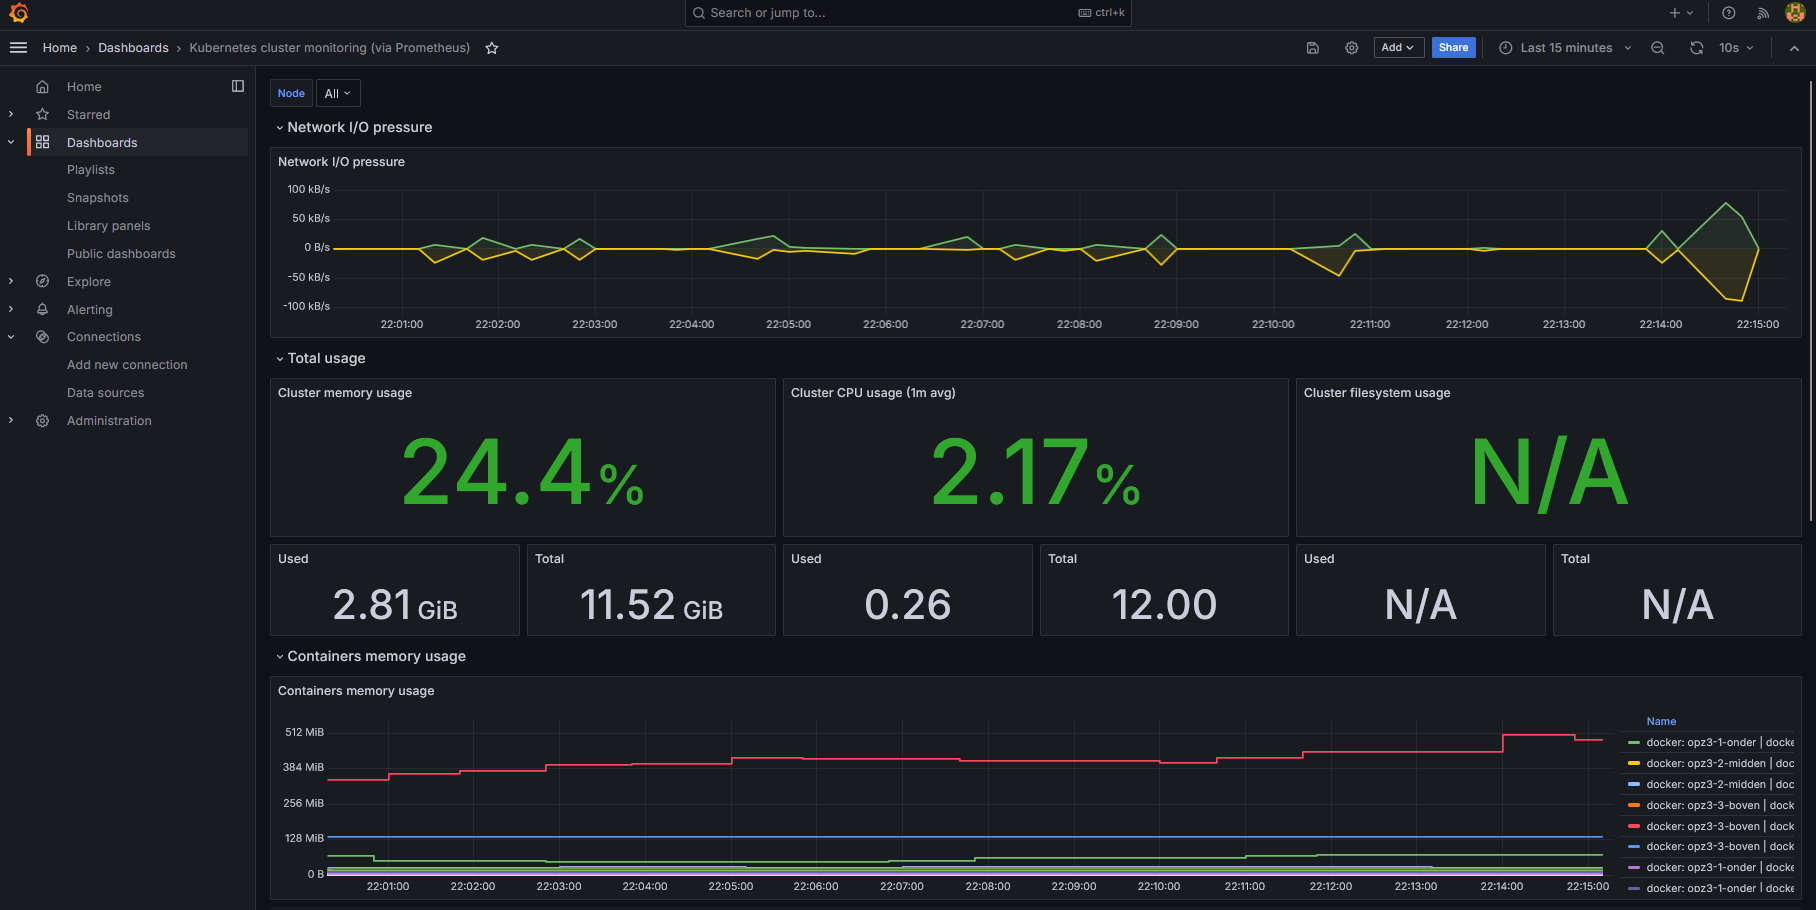
In the end I even managed to deploy Grafana & Prometheus (via Helm charts):
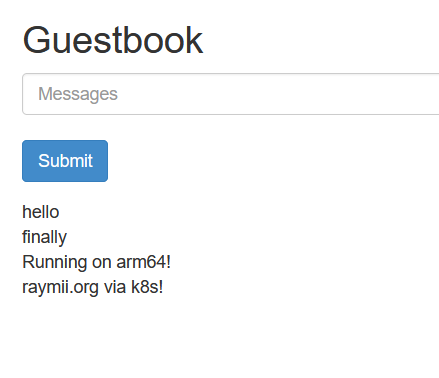
The Guestbook application
was a big issue because the guide uses container images that are not built
for ARM64, but I managed to deploy that by manually using other images that
were suitable for ARM64. It seemed to be working, I could post messages, but
after every refresh of the page, all messages were gone. Turned out to be a
redis-slave version difference, redis-master was running version 6.0.5
and slave was running 3.2.9, which was due to the different images for ARM64.
After fixing that with an image that runs the correct redis version on ARM64
all worked. Lots of kubectl exec -ti redis-master-podname -- sh and
debugging (exec 3<> /dev/tcp/redis-master/6379; echo INFO >&3; cat <&3 due
to the lack of telnet or netcat) but that helps me learn this stuff. My
yaml files for ARM64 are on github for reference.
The version of Kubernetes/k3s I use
for this article is v1.29.6+k3s1.
Setup the first node (control plane)
Choose one of your cluster nodes to be the first which will not only be a
worker node but also host the control plane. You can install just one node,
because in the case of k3s that node will also become a worker node.
I run the Orange Pi Boards without a Micro SD Card,
they boot up via PXE with an NFS root file system, so I cannot use
overlayfs2. Therefore during installation I provide an extra parameter to
use the native shapshotter. Also some etcd timeouts are raised.
Install k3s using their installer:
curl -sfL https://get.k3s.io | sh -s - --snapshotter=native --etcd-arg
election-timeout=5000 --etcd-arg heartbeat-interval=1000
Output:
  [INFO]  Finding release for channel stable
  [INFO]  Using v1.29.5+k3s1 as release
  [INFO]  Downloading hash https://github.com/k3s-io/k3s/releases/download/v1.29.5+k3s1/sha256sum-arm64.txt
  [INFO]  Downloading binary https://github.com/k3s-io/k3s/releases/download/v1.29.5+k3s1/k3s-arm64
  [INFO]  Verifying binary download
  [INFO]  Installing k3s to /usr/local/bin/k3s
  [INFO]  Skipping installation of SELinux RPM
  [INFO]  Creating /usr/local/bin/kubectl symlink to k3s
  [INFO]  Creating /usr/local/bin/crictl symlink to k3s
  [INFO]  Creating /usr/local/bin/ctr symlink to k3s
  [INFO]  Creating killall script /usr/local/bin/k3s-killall.sh
  [INFO]  Creating uninstall script /usr/local/bin/k3s-uninstall.sh
  [INFO]  env: Creating environment file /etc/systemd/system/k3s.service.env
  [INFO]  systemd: Creating service file /etc/systemd/system/k3s.service
  [INFO]  systemd: Enabling k3s unit
  Created symlink /etc/systemd/system/multi-user.target.wants/k3s.service - /etc/systemd/system/k3s.service.
  [INFO]  Host iptables-save/iptables-restore tools not found
  [INFO]  Host ip6tables-save/ip6tables-restore tools not found
  [INFO]  systemd: Starting k3s
(Remove the --snapshotter=native part if you are not running a root filesystem on NFS).
Get the token for cluster installation (adding the other nodes to the cluster):
cat /var/lib/rancher/k3s/server/node-token
Output:
K10a[...]418::server:7a8[...]8e441
Save that output somewhere.
Alsop save the configuration file for the admin workstation setup later on:
cat /etc/rancher/k3s/k3s.yaml
Output:
apiVersion: v1
clusters:
- cluster:
  certificate-authority-data: LS0[...]0K
  server: https://127.0.0.1:6443
  name: default
contexts:
- context:
  cluster: default
  user: default
  name: default
current-context: default
kind: Config
preferences: {}
users:
- name: default
  user:
  client-certificate-data: LS0[...]LS0K
  client-key-data: LS0t[...]LQo=
If you want to set up just one node you can continue on to the admin workstation setup. Otherwise, repeat the next section for every other board you want to add to the cluster.
You can test if the install worked with the following command:
kubectl get nodes
Output should be a list of cluster nodes, currently just one:
NAME            STATUS   ROLES                  AGE     VERSION
opz3-2-midden   Ready    control-plane,master   2d22h   v1.29.5+k3s1
Setup the worker nodes
These steps are a bit different and must be done on the worker nodes.
Install k3s with the install script but provide the server address
(K3S_URL) and token you saved earlier:
curl -sfL https://get.k3s.io | K3S_URL="https://192.0.2.60:6443"
K3S_TOKEN="K10a[...]c6418::server:7a
[...]41" sh -s - --snapshotter=native
(Omit --snapshotter=native if you are not running an NFS root filesystem).
Output:
[INFO]  Finding release for channel stable
[INFO]  Using v1.29.5+k3s1 as release
[INFO]  Downloading hash https://github.com/k3s-io/k3s/releases/download/v1.29.5+k3s1/sha256sum-arm64.txt
[INFO]  Skipping binary downloaded, installed k3s matches hash
[INFO]  Skipping installation of SELinux RPM
[INFO]  Skipping /usr/local/bin/kubectl symlink to k3s, already exists
[INFO]  Skipping /usr/local/bin/crictl symlink to k3s, already exists
[INFO]  Skipping /usr/local/bin/ctr symlink to k3s, already exists
[INFO]  Creating killall script /usr/local/bin/k3s-killall.sh
[INFO]  Creating uninstall script /usr/local/bin/k3s-agent-uninstall.sh
[INFO]  env: Creating environment file /etc/systemd/system/k3s-agent.service.env
[INFO]  systemd: Creating service file /etc/systemd/system/k3s-agent.service
[INFO]  systemd: Enabling k3s-agent unit
Created symlink /etc/systemd/system/multi-user.target.wants/k3s-agent.service - /etc/systemd/system/k3s-agent.service.
[INFO]  Host iptables-save/iptables-restore tools not found
[INFO]  Host ip6tables-save/ip6tables-restore tools not found
[INFO]  systemd: Starting k3s-agent
Repeat the above shell command for all other nodes for this cluster.
You can test if the install worked with the following command on the master node:
kubectl get nodes
Output should be a list of cluster nodes:
NAME            STATUS   ROLES                  AGE     VERSION
opz3-2-midden   Ready    control-plane,master   2d22h   v1.29.5+k3s1
opz3-3-boven    Ready    <none>                 2d22h   v1.29.5+k3s1
opz3-1-onder    Ready    <none>                 2d2h    v1.29.5+k3s1
Admin workstation (your desktop)
You should manage the cluster not on the nodes but on your workstation using
kubectl, the command line tool for managing Kubernetes clusters. You also
need it on your (linux) desktop to gain access to the kubernetes dashboard
later on (it forwards a port to an internal service, localhost only).
Install kubectl by following the official guide. I used their provided debian APT repository.
Create a folder for the configuration:
mkdir -p ~/.kube
Paste contents of cat /etc/rancher/k3s/k3s.yaml we saved earlier from the
control plane node into the following file:
vim ~/.kube/config
Replace server: https://127.0.0.1:6443 with the IP of your first server.
Change permissions of the file:
chmod 600 ~/.kube/config
Test using the same command we used after installing each node:
kubectl get nodes
Output:
NAME            STATUS   ROLES                  AGE     VERSION
opz3-2-midden   Ready    control-plane,master   2d22h   v1.29.5+k3s1
opz3-3-boven    Ready    <none>                 2d22h   v1.29.5+k3s1
opz3-1-onder    Ready    <none>                 2d2h    v1.29.5+k3s1
Install Dashboard UI (via Helm)
Execute these steps on the admin workstation. Start by installing helm. Helm
is what we use to install the dashboard. Use the below command or your package manager:
curl -fsSL https://raw.githubusercontent.com/helm/helm/main/scripts/get-helm-3 | bash
Add the kubernetes-dashboard helm repository:
helm repo add kubernetes-dashboard https://kubernetes.github.io/dashboard/
Output:
"kubernetes-dashboard" has been added to your repositories
Install the Dashboard UI:
helm upgrade --install kubernetes-dashboard
kubernetes-dashboard/kubernetes-dashboard --create-namespace --namespace
kubernetes-dashboard
Output:
Release "kubernetes-dashboard" does not exist. Installing it now.
NAME: kubernetes-dashboard
LAST DEPLOYED: Sat Jun 22 22:44:26 2024
NAMESPACE: kubernetes-dashboard
STATUS: deployed
REVISION: 1
TEST SUITE: None
NOTES:
*************************************************************************************************
*** PLEASE BE PATIENT: Kubernetes Dashboard may need a few minutes to get up and become ready ***
*************************************************************************************************

Congratulations! You have just installed Kubernetes Dashboard in your cluster.

To access Dashboard run:
  kubectl -n kubernetes-dashboard port-forward svc/kubernetes-dashboard-kong-proxy 8443:443

NOTE: In case port-forward command does not work, make sure that kong service name is correct.
    Check the services in Kubernetes Dashboard namespace using:
    kubectl -n kubernetes-dashboard get svc

Dashboard will be available at:
  https://localhost:8443
Access Dashboard.
To access the dashboard you first need to create a user that can generate a token. Each time you want to access the token you must first get a token using a command and then forward the ports. Follow the Login Credentials section below first to create the correct user. Afterwards, to get access to the dashboard, execute these commands:
kubectl -n kubernetes-dashboard create token admin-user

kubectl -n kubernetes-dashboard port-forward svc/kubernetes-dashboard-kong-proxy 8443:443
Kubectl will make Dashboard available at https://localhost:8443/#/login
Login credentials for the dashboard
On your workstation, create a folder for our YAML files:
mkdir k8s
cd k8s
Create a file for the admin user:
vim dashboard.admin-user.yml
Contents:
apiVersion: v1
kind: ServiceAccount
metadata:
  name: admin-user
  namespace: kubernetes-dashboard
Create a file for the admin user role:
vim dashboard.admin-user-role.yml
Contents:
apiVersion: rbac.authorization.k8s.io/v1
kind: ClusterRoleBinding
metadata:
  name: admin-user
roleRef:
  apiGroup: rbac.authorization.k8s.io
  kind: ClusterRole
  name: cluster-admin
subjects:
- kind: ServiceAccount
  name: admin-user
  namespace: kubernetes-dashboard
Execute the following command to apply both files:
kubectl create -f dashboard.admin-user.yml -f dashboard.admin-user-role.yml
Output:
serviceaccount/admin-user created
clusterrolebinding.rbac.authorization.k8s.io/admin-user created
Try to get a token to login to the dashboard:
kubectl -n kubernetes-dashboard create token admin-user
Output:
eyJh[...]HWRw
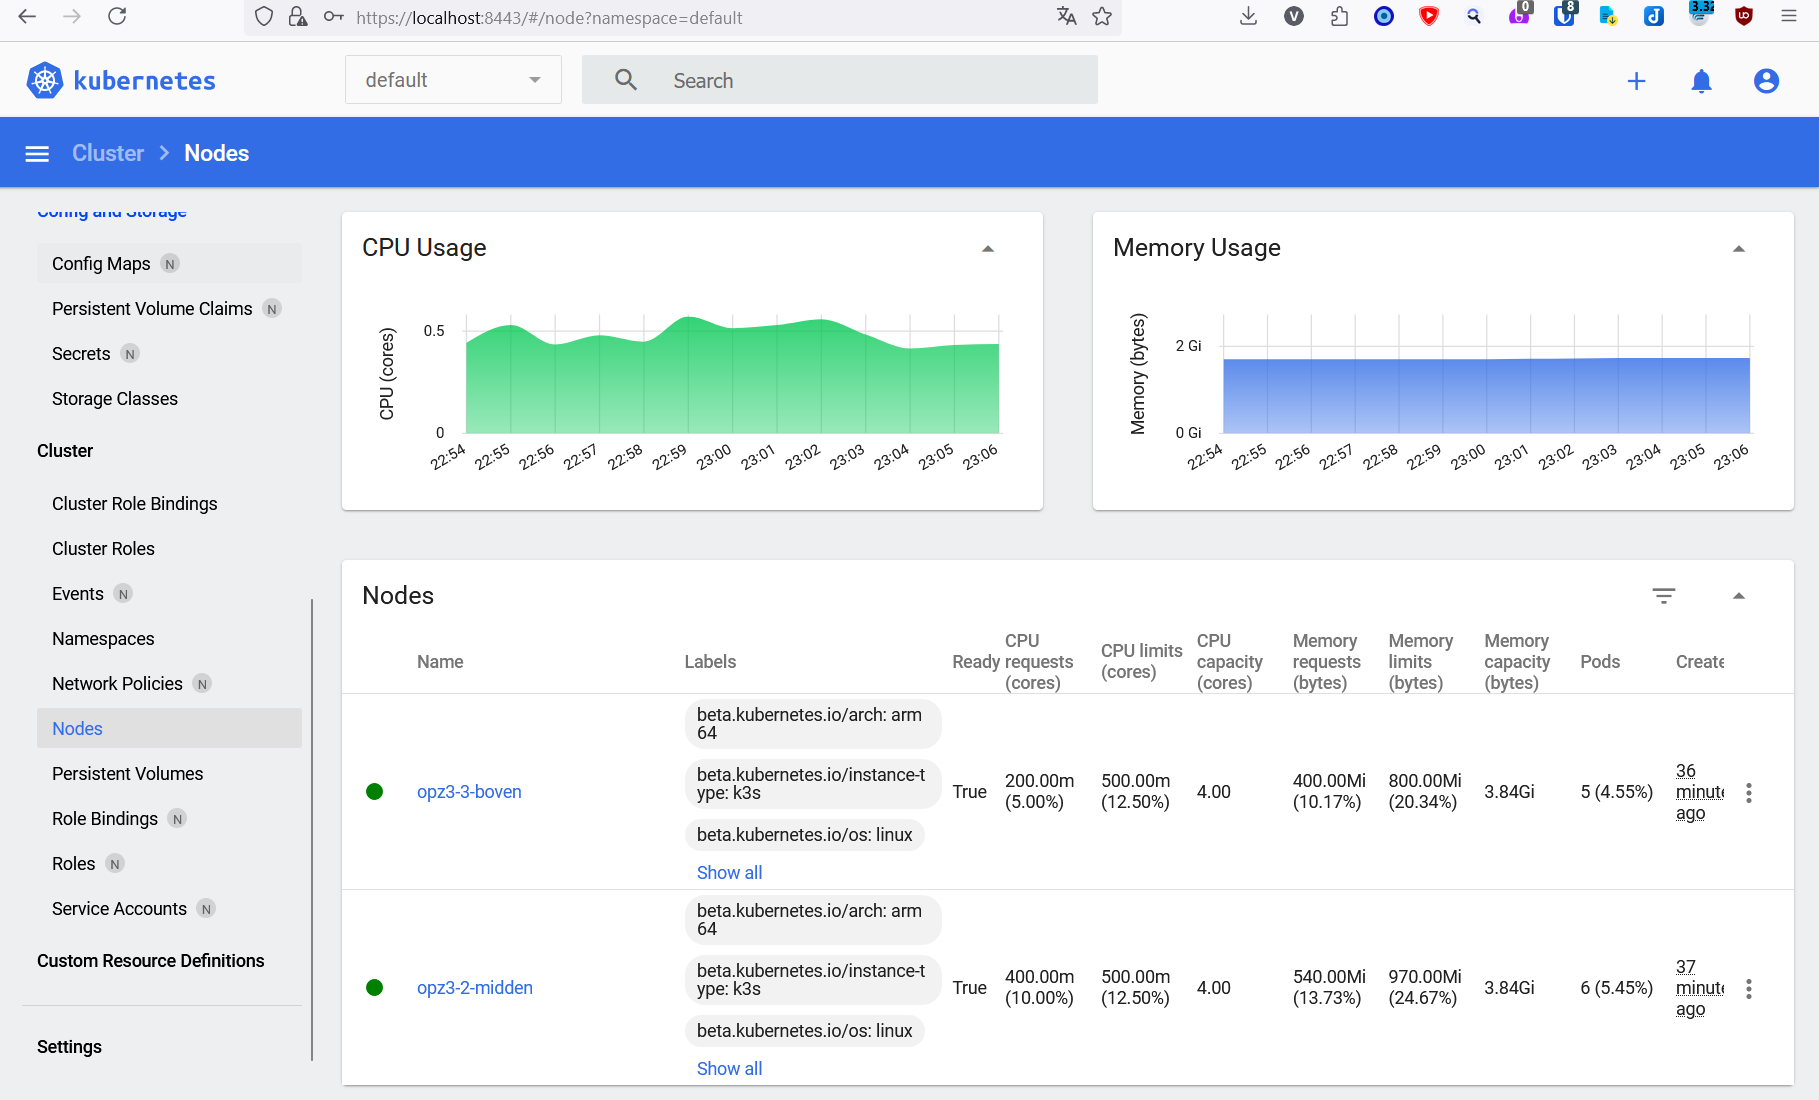
Login and go to the Nodes page to see your cluster in all it's glory:
Test Deployment
Create a folder for your deployment yaml files:
mkdir k8s-test
cd k8s-test
Most guides just have you executing a shell command, but that's not very reproducable nor declarative. This is an example command:
kubectl create deployment hello-node --image=registry.k8s.io/e2e-test-images/agnhost:2.39 -- /agnhost netexec --http-port=8080
Output:
deployment.apps/hello-node created
Lets skip this imperative part and jump right into the good stuff (declarative, files you can put in source control).
Create a yaml file for our test pod:
vim hello-node-pod.yaml
Contents:
apiVersion: v1
kind: Pod
metadata:
  name: hello-kube-pod
  labels:
  component: web
spec:
  containers:
  - name: hello-kube
    image: registry.k8s.io/e2e-test-images/agnhost:2.39
    ports:
    - containerPort: 8080
    command: ["/agnhost"]
  args: ["netexec", "--http-port=8080"]
Feed this configuration to your cluster with the following command:
kubectl apply -f hello-node-pod.yaml
Output:
pod/hello-kube-pod created
Check the status of the pods:
kubectl get pods
Output:
NAME                         READY   STATUS    RESTARTS      AGE
hello-kube-pod               1/1     Running   0             11s
Logging from indside the Pod:
kubectl logs hello-kube-pod
Output:
I0624 04:27:56.441749       1 log.go:195] Started HTTP server on port 8080
I0624 04:27:56.442405       1 log.go:195] Started UDP server on port  8081
The pod is only reachable from the internal network of the kubernetes cluster.
You need to expose the pod as a Kubernetes Service of the type
LoadBalancer. If you are running Kubernetes on a public provider like
Google Compute Engine, you'd want to use a NodePort because you probably
pay more for LoadBalancer than for a NodePort.
If we were doing the imperative style guide you would use the following command:
kubectl expose deployment hello-node --type=LoadBalancer --port=8080
But we're not doing that. Create a Yaml file for the loadbalancer:
vim hello-node-loadbalancer.yaml
Contents:
apiVersion: v1
kind: Service
metadata:
  name: hello-kube-load-balancer-service
spec:
  type: LoadBalancer
  ports:
  - port: 8081
    targetPort: 8080
  selector:
  component: web
The hello-node pod only listens on port 8080 as we configured during the
deployment. We expose it as port 8081 on the cluster.
Output:
service/hello-kube-load-balancer-service created
Check the status of the new Service:
kubectl get services
Output:
NAME                               TYPE           CLUSTER-IP      EXTERNAL-IP                           PORT(S)
 AGE
kubernetes                         ClusterIP      10.43.0.1       <none>                                443/TCP
 31h
hello-kube-load-balancer-service   LoadBalancer   10.43.21.156    192.0.2.60,192.0.2.61,192.0.2.62   8081:32745/TCP   8s
In my case the output shows that the hello-node LoadBalancer runs on all
three of the Orange Pi k3s nodes on port 8081.
If you visit the IP+Port in your browser by default agnhost will echo back
the request timestamp:
NOW: 2024-06-23 17:49:08.920400061 +0000 UTC m=+516.182935643
Adding the path /hostname will echo the servers hostname:
hello-node-ccf4b9788-gzs26
Do note that you can run shell commands in this container so make sure you do not expose it to the internet:
http://IP:PORT/shell?cmd=uname%20-a
Output:
{"output":"Linux hello-node-ccf4b9788-gzs26 6.6.31-current-sunxi64 #1 SMP
Fri May 17 10:02:40 UTC 2024 aarch64 Linux\n"}
Testing failover
In the Kubernetes Dashboard under Pods you can see which node is running the pod:
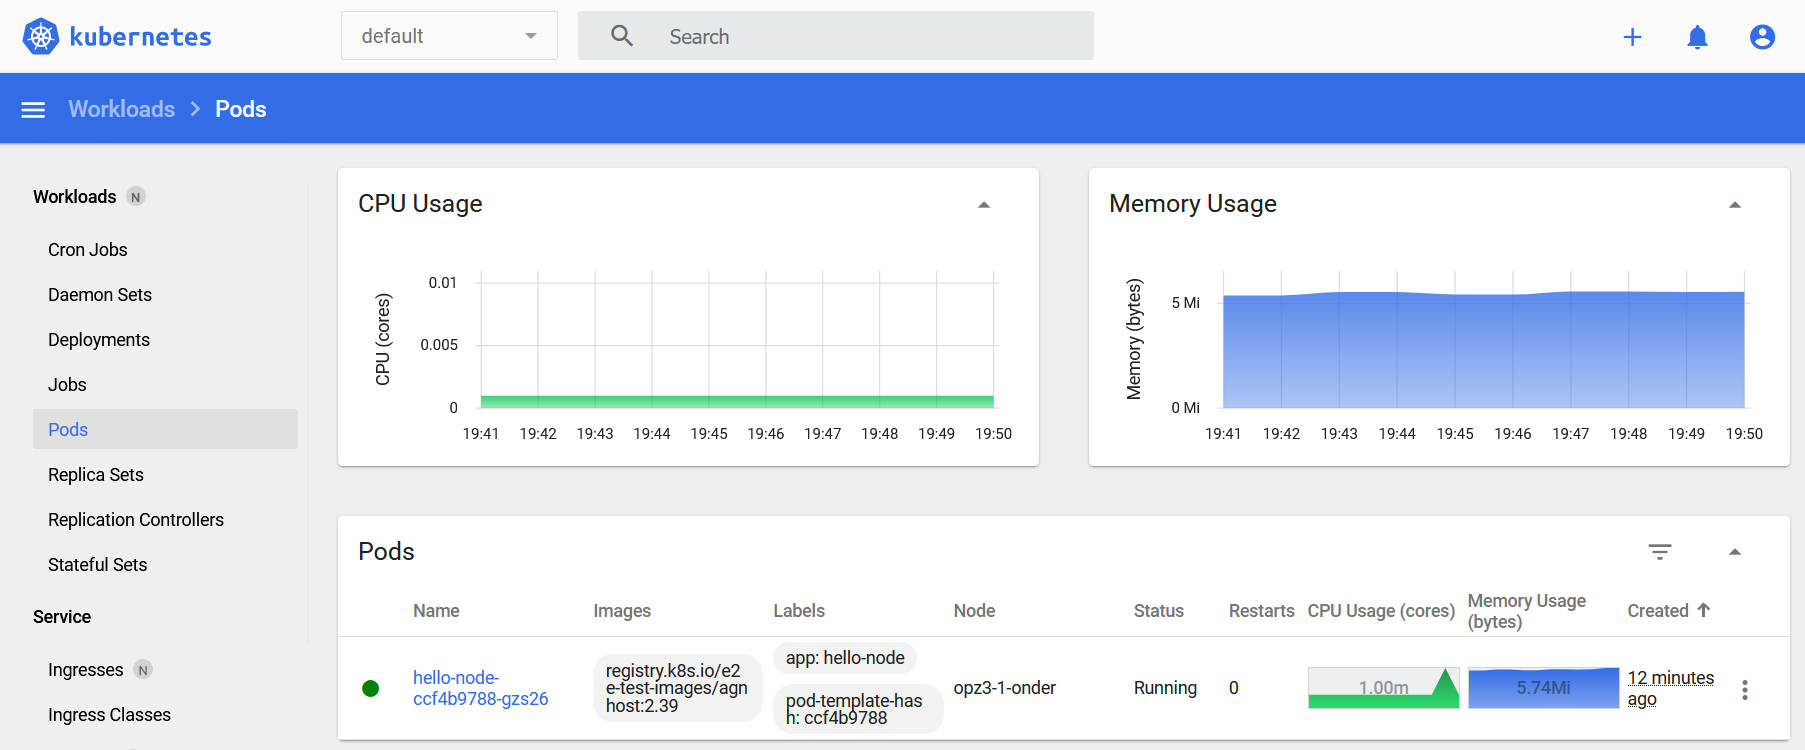
You can also use the following command to get that information:
kubectl get pods -o wide --all-namespaces --sort-by="{.spec.nodeName}"
Output:
NAMESPACE              NAME                                                    READY   STATUS      RESTARTS       AGE     IP            NODE            NOMINATED NODE   READINESS GATES
kube-system            svclb-frontend-d7256f7a-h27bw                           1/1     Running     0              56m     10.42.2.134   opz3-1-onder    <none>           <none>
kube-system            svclb-prometheus-server-ext-ac974dfa-qzdnp              1/1     Running     10 (12h ago)   3d23h   10.42.2.102   opz3-1-onder    <none>           <none>
guestbook              frontend-58d8fd4874-x8qsg                               1/1     Running     0              15m     10.42.2.180   opz3-1-onder    <none>           <none>
guestbook              frontend-58d8fd4874-kpk69                               1/1     Running     0              15m     10.42.2.179   opz3-1-onder    <none>           <none>
In my case its the node opz3-1-onder. If I power that machine off, the node will first go in the NotReady state:
kubectl get nodes
Output:
NAME            STATUS     ROLES                  AGE   VERSION
opz3-1-onder    NotReady   <none>                 74m   v1.29.5+k3s1
opz3-3-boven    Ready      <none>                 21h   v1.29.5+k3s1
opz3-2-midden   Ready      control-plane,master   21h   v1.29.5+k3s1
After 5 minutes the pod will be created on another node, as seen in the events log:
kubectl events
Output
LAST SEEN             TYPE      REASON                 OBJECT                            MESSAGE
23m                   Normal    ScalingReplicaSet      Deployment/hello-node             Scaled up replica set hello-node-ccf4b9788 to 1
23m                   Normal    SuccessfulCreate       ReplicaSet/hello-node-ccf4b9788   Created pod: hello-node-ccf4b9788-gzs26
23m                   Normal    Scheduled              Pod/hello-node-ccf4b9788-gzs26    Successfully assigned default/hello-node-ccf4b9788-gzs26 to opz3-1-onder
23m                   Normal    Pulling                Pod/hello-node-ccf4b9788-gzs26    Pulling image "registry.k8s.io/e2e-test-images/agnhost:2.39"
23m                   Normal    Pulled                 Pod/hello-node-ccf4b9788-gzs26    Successfully pulled image "registry.k8s.io/e2e-test-images/agnhost:2.39" in 13.116s (13.116s including waiting)
23m                   Normal    Created                Pod/hello-node-ccf4b9788-gzs26    Created container agnhost
23m                   Normal    Started                Pod/hello-node-ccf4b9788-gzs26    Started container agnhost
18m                   Normal    EnsuringLoadBalancer   Service/hello-node                Ensuring load balancer
18m                   Normal    AppliedDaemonSet       Service/hello-node                Applied LoadBalancer DaemonSet kube-system/svclb-hello-node-b0ca2b59
18m                   Normal    UpdatedLoadBalancer    Service/hello-node                Updated LoadBalancer with new IPs: [] -> [192.0.2.60]
18m                   Normal    UpdatedLoadBalancer    Service/hello-node                Updated LoadBalancer with new IPs: [192.0.2.60] -> [192.0.2.60 192.0.2.62]
18m                   Normal    UpdatedLoadBalancer    Service/hello-node                Updated LoadBalancer with new IPs: [192.0.2.60 192.0.2.62] -> [192.0.2.60 192.0.2.61 192.0.2.62]
7m41s (x2 over 73m)   Normal    NodeNotReady           Node/opz3-1-onder                 Node opz3-1-onder status is now: NodeNotReady
7m41s                 Warning   NodeNotReady           Pod/hello-node-ccf4b9788-gzs26    Node is not ready
7m41s                 Normal    UpdatedLoadBalancer    Service/hello-node                Updated LoadBalancer with new IPs: [192.0.2.60 192.0.2.61 192.0.2.62] -> [192.0.2.61 192.0.2.62]
2m36s                 Normal    TaintManagerEviction   Pod/hello-node-ccf4b9788-gzs26    Marking for deletion Pod default/hello-node-ccf4b9788-gzs26
2m36s                 Normal    SuccessfulCreate       ReplicaSet/hello-node-ccf4b9788   Created pod: hello-node-ccf4b9788-5rwdv
2m35s                 Normal    Scheduled              Pod/hello-node-ccf4b9788-5rwdv    Successfully assigned default/hello-node-ccf4b9788-5rwdv to opz3-2-midden
2m35s                 Normal    Pulling                Pod/hello-node-ccf4b9788-5rwdv    Pulling image "registry.k8s.io/e2e-test-images/agnhost:2.39"
2m23s                 Normal    Pulled                 Pod/hello-node-ccf4b9788-5rwdv    Successfully pulled image "registry.k8s.io/e2e-test-images/agnhost:2.39" in 11.63s (11.63s including waiting)
2m23s                 Normal    Created                Pod/hello-node-ccf4b9788-5rwdv    Created container agnhost
2m23s                 Normal    Started                Pod/hello-node-ccf4b9788-5rwdv    Started container agnhost
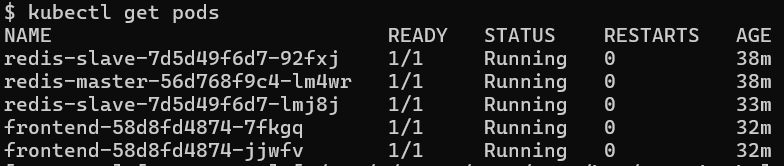
The old pod is being terminated:
kubectl get pods
Output:
  NAME                         READY   STATUS        RESTARTS   AGE
  hello-node-ccf4b9788-gzs26   1/1     Terminating   0          84m
  hello-node-ccf4b9788-5rwdv   1/1     Running       0          63m
This will succeed once the node comes back online again.
Time for a bit of theory on how this all works. (via)
The Kubernetes controller plane is responsible for watching the state of nodes in the cluster. There are a few configurable options at play in determining the health of nodes:
node-monitor-period(Default: 5s): The period for syncingNodeStatusinNodeController.node-monitor-grace-period(Default: 40s): Amount of time which we allow runningNodeto be unresponsive before marking it unhealthypod-eviction-timeout(Default: 5m0s): The grace period for deleting pods on failed nodes.
These options mean that every 5 seconds the node must respond to a heart beat from the master node. If the node ever fails to respond, it has 40 seconds to successfully respond. After 40 seconds, the node is marked as Unknown. If the node remains Unknown (or NotReady) for 5 minutes, then all pods on that node will be deleted.
After 5 minutes Kubernetes has successfully quarantined the node and triggered a delete of all pods on the node. Those pods will then get rescheduled for deployment on a working node.
This is different for Stateful Sets but I'll save those for another day.
Tags: armbian , cloud , helm , k3s , k8s , kubernetes , linux , orange-pi , raspberry-pi , tutorials