Raymii.org

Quis custodiet ipsos custodes?Home | About | All pages | Cluster Status | RSS Feed
Rectangle{} debugging in QML, just like printf(), but for QT
Published: 08-09-2021 | Author: Remy van Elst | Text only version of this article
❗ This post is over three years old. It may no longer be up to date. Opinions may have changed.
Table of Contents
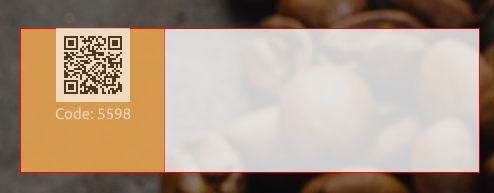
Rectangle{} debugging on QML anchors
Recently I've been using a debugging technique in QT/QML that I've decided
to name Rectangle{} debugging, in the same vein as printf() debugging.
QML is a markup language (part of the QT framework) like HTML/CSS, with
inline JavaScript that can interact with the C++ code of your (QT) application.
QML has the concept of anchors for relative positioning of elements. Overall,
anchors work quite well, but can get complex when inheritance and complicated
layouts come into play. The Rectangle{} style of debugging places a semi-transparent
rectangle with a border around your element so you can visualize the positioning
and see what effect your changes have. This article shows an example where I
recently applied this style of debugging at work in our coffee machine user interface,
including some tips to do actual printf() style debugging (but with Console.log).
Recently I removed all Google Ads from this site due to their invasive tracking, as well as Google Analytics. Please, if you found this content useful, consider a small donation using any of the options below. It means the world to me if you show your appreciation and you'll help pay the server costs:
GitHub Sponsorship
PCBWay referral link (You get $5, I get $20 after you've placed an order)
Digital Ocea referral link ($200 credit for 60 days. Spend $25 after your credit expires and I'll get $25!)
I've written about QT / QML before, that article went into signalling and slots, a method to communicate between C++ and QML.
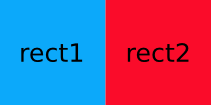
The Qt Quick anchoring system allows you to define relationships between the anchor lines of different items. For example, you can write:
Rectangle { id: rect1; ... }
Rectangle { id: rect2; anchors.left: rect1.right; ... }
In this case, the left edge of rect2 is bound to the right edge of rect1,
producing the following:
As said, this gets complex quickly, especially when anchors / positions depend on dynamic variables that come in via signals from the C++ side. QT Design Studio is also not usable in our projects due to platform specific limitations.
What is printf() debugging? It's a technique named after the ubiquitous
C function. Used to describe debugging work done by inserting commands that
output more or less carefully chosen status information at key points in the
program flow, observing that information and deducing what's wrong based on
that information.
I prefer a dedicated debugger, but it has to be good and integrated in my IDE. CLion has this, Visual Studio has a reasonable one and QT Creator's QML debugger is just bad.
For visual elements like in QML, it's harder to debug positioning and relative
stuff. Next to that, QT Creator has a QML debugger, but that is horrible to use.
Unresponsive, missing breakpoints, all kinds of other weird stuff that just works
terrible. Using this rectangle trick makes elements, boundaries and changes very
visible. To center an object, do you use anchors.centerIn: parent or
anchors.horizontalCenter: parent.horizontalCenter? With a big rectangle
around your change, it is way more visible what a change does.
Rectangle{} debugging
Recently I had to implement the touchless coffee feature for one of our machine user interfaces, that uses QT. The QML control already existed, but it had to be placed on a few screen, conditionally replacing another element depending on a setting. The first attempt to place the control in that other element resulted in a small, non-centered element. Below is a picture showing the first attempt on the left and the final result on the right:
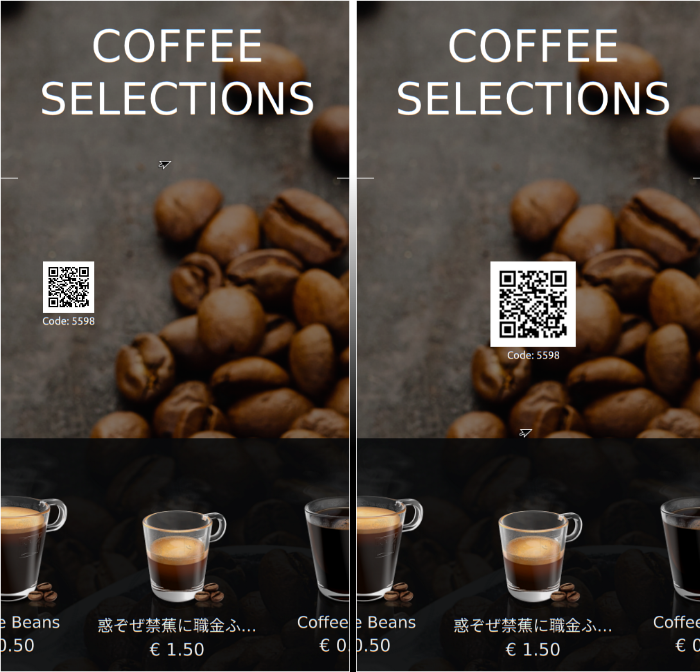
QML User Interface, before (wrong) on the left, after (correct) on the right
The blurriness in the screenshots is due to the fact that I resized them to fit better on the site, on the machine they're super crisp.
The element that was conditionally replaced, was resized and centered, the QML syntax was copied over and it resulted in something unexpected. The first thing I did was put a rectangle around the container, to visualize what was going on:
Rectangle {
    anchors.fill: parent
    color: "#ffffff"
    visible: true
    opacity: 0.8
    border.color: "#ff0000"

    //insert your objects here
}
It looks like this:
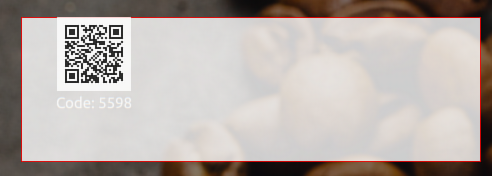
As you can see, the new qr image is not exactly on the top-leftmost corner, so
inside the QR control there is some positioning going on. Let's put another
Rectangle in the QR code control to see what that is doing. This time the
background color is light orange, to distinct it from the outer container:
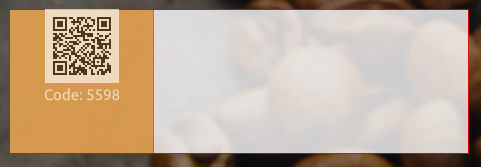
Inside the QR control the size is also not as I would expect, the centering is
correct. Remember, that specific control is already used on other UI's,
working correctly. Let's fiddle around with the Image.Fillmode, Pad or
PreserveAspectFit should do the trick, as well as some anchors.fill:
parent sprinkled here and there:
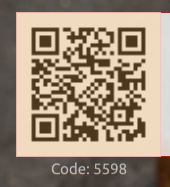
Almost there, as you can see, the Code: text is now outside of both
controls. That has an anchor.top: qrimage.bottom, which is correct, but if
this control would be cropped, the text would not be visible. If I had not
used this Rectangle{} debugging method, I would not have noticed that,
which might cause bugs in the future.
Let's test with Image.width: ### * 0.85:
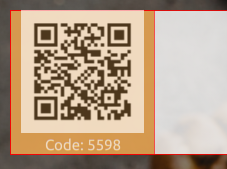
Better, but when the control is larger, still not correct, too much space at
the bottom. Fixing that is outside of this article's scope. Continue on with
centering the control. That was a case of the correct combination of
anchors.fill: parent and anchors.horizontalCenter:
parent.horizontalCenter in a few controls. I'll spare you the details, after
a few minutes I found the correct combo:
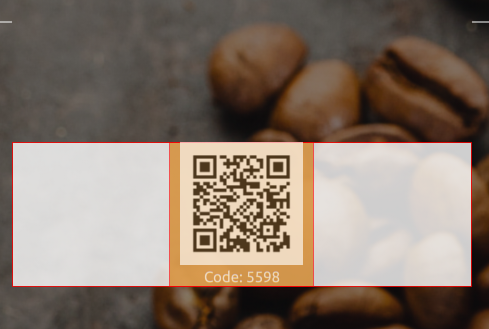
The only thing left now is to remove the rectangles (or, even more evil, make them transparent) and finish up the feature.
Without the rectangle debugging technique, I would probably not have spotted the text being outside of the image. Or there would be discussion over if a control is in the exact center. Making it visual and visible is so much more helpful than staring at a debugger in this case.
If you're wondering, this is how the webpage looks after you've scanned the QR code:
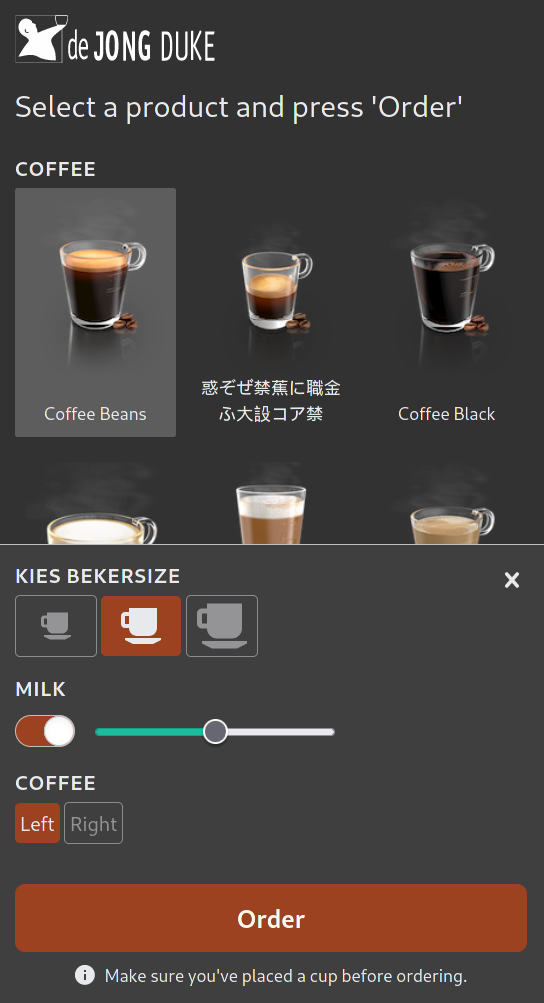
This specific QR code never worked since it was only active in a development environment, but you might be wondering what would happen if you scanned the code. It gives you a webpage with all the machines consumptions, choose one, customize the drink and press Order. Machine starts producing it, all without the user having to touch the screen. Uses MQTT on the backend, less than 7 MB a month in data usage, super responsive, really cool to develop. But that is a story for another day.
Console.log QML debugging
QML mixes markup language with inline JavaScript, which in my case can be helpful
when debugging. For example, the visibility of an element can be determined by
QML properties or via C++ signals and slots. By replacing the visible: varName
with a JavaScript function call, we can log the value to the console. By doing
that, I can exclude that boolean value if an element is invisible, but should be
visible. It helps to figure out if the styling (z-index for example) is the issue
or the actual value returned.
Here is an example QML file:
Item {
  function logAndReturnValue(varToLog)
  {
    console.log("value: " + varToLog);
    return varToLog;
  }
  property bool varName: false;

  Text {
    visible: logAndReturnValue(varName)
    text: "Example Text"
  }
}
This simple example function takes a variable, logs it to the console and returns the result.
The Text element has the line visible:, which is the boolean value true or false, or
another variable containing a boolean or a function returning a boolean. By using signals
you can set this via C++ code, see my other example article for how that works.
Effectively you could just write visible: varName, but with this logging method, you
get it printed as well.
Next to using this method, you can also hook into the Component.onCompleted signal handler,
that is emitted after an object has been instantiated:
Text {
    Component.onCompleted: console.log("Text onCompleted.")
    text: "Example Text"
}
In my experience, the QML debugger is a hassle to work with, not even remotely as polished as CLion's GDB integration. It's also a bit weird at times, not updating with results, not correctly stepping over, all kinds of small issues. I often prefer this printf-style debugging in QML due to how bad QT Creator and their QML debugger is.
Tags: articles , c , c++ , cpp , debugging , development , javascript , printf , qml , qt , qt5