Raymii.org

אֶשָּׂא עֵינַי אֶל־הֶהָרִים מֵאַיִן יָבֹא עֶזְרִֽי׃Home | About | All pages | Cluster Status | RSS Feed
Service checks in LibreNMS (http, all other Nagios plugins)
Published: 10-09-2018 | Author: Remy van Elst | Text only version of this article
❗ This post is over seven years old. It may no longer be up to date. Opinions may have changed.
Table of Contents
LibreNMS is becoming one of my favorite monitoring tools. Setup and getting started is easy and it has enough advanced options and tunables. I recently discovered that LibreNMS is able to check services as well. Services, in this context, means, executing Nagios plugins (like check http, check ping, etc). This allows you to check services that SNMP does not cover by default, like HTTP(s) health checks, certificate expiry, tcp port checks (e.g. rdp) and anything for which you can write a Nagios plugin yourself. The performance data, if available, is graphed automatically. Alerting is done with the regular LibreNMS alerts. This guide covers the setup of services (it's not enabled by default) and a few basic checks, like an http health check, certificate expiry and SSH monitoring.
You need a LibreNMS server for this guide to work. The project provides excellent documentation. To get started, get a Digital Ocean VPS and follow the official guide for Ubuntu.
Nagios check plugins
For those unfamiliar with Nagios, it is a monitoring system which can execute checks. These checks are scripts and progams which take input (for example, which host to check, tresholds), do a check and then return an exit code and some performance data. The plugins can be in any language, Nagios only cares about the exit codes. They can be the following:
- 0: OK
- 1: WARNING
- 2: CRITICAL
- 3: OK
- 4 and up: UNKNOWN
For example, to check if a website is working, you would use the check_http
plugin. This plugin checks if the site returns a 200 OK and if so, gives exit
status 0. If not, for example because of a timeout, access denied or 50x
error, it will return status 1 or 2. Nagios then can do all kinds of
alerting based on those statusses.
Performance data is comma seperated value data added after the status output in the command result. This can be anything, for example, the time the HTTP request took.
Since you can write these scripts yourself any monitoring system that uses these plugins is very extensible. It can check anything you want as long as you can write a script for it. This makes the monitoring tool very powerfull, you're not limited to what they provide.
To read more about monitoring, you can read one of my other articles.
Enabling service checks
Service checks are not enabled by default in LibreNMS. The documentation
explains how to enable the module. In this guide I asume your path is
/opt/librenms/. Edit your config file:
vim /opt/librenms/config.php
Add the following line:
$config['show_services'] = 1;
Save the file.
Edit the LibreNMS cronjob to include service checks:
vim /etc/cron.d/librenms
Add:
*/5 * * * * librenms /opt/librenms/services-wrapper.py 1
Make sure the Nagios plugins are installed:
apt-get install nagios-plugins nagios-plugins-extra
Do a test to see if the plugins work:
/usr/lib/nagios/plugins/check_http -H raymii.org -S -p 443
Example output:
HTTP OK: HTTP/1.1 200 OK - 1320 bytes in 0.199 second response time |time=0.198748s;;;0.000000 size=1320B;;;0
Adding a (dummy) host
You must have a host in LibreNMS to be able to add service checks. Normally you
would use snmp to monitor devices, but if you just want to do simple (HTTP)
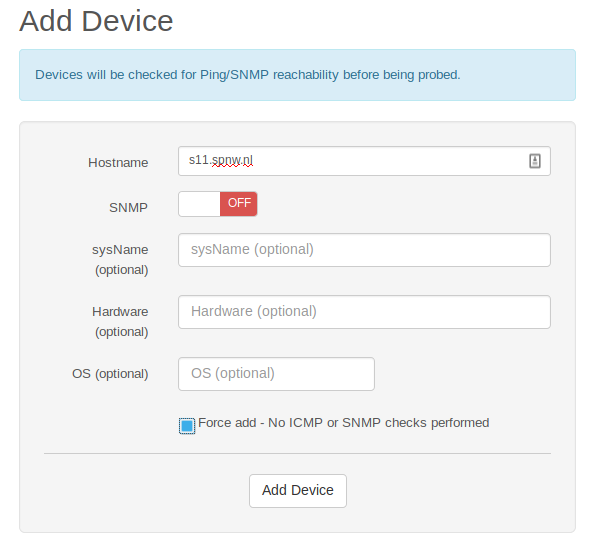
checks without SNMP you can add a host without SNMP or TCP checks. Via
Devices, Add Device you can enter an URL/IP. Uncheck the SNMP checkbox and
check the Force add button:
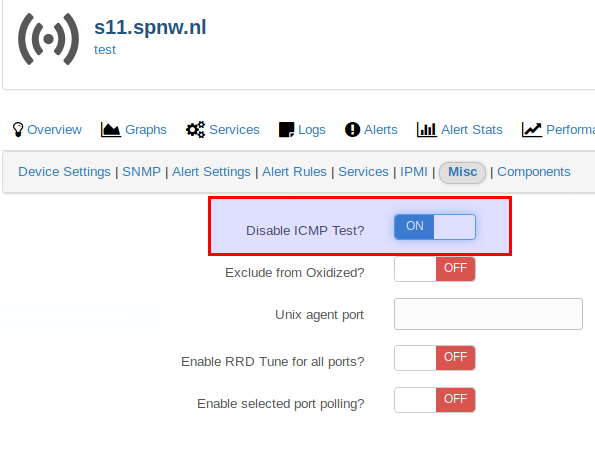
If this device does not accept ICMP (ping) traffic, you can disable that as well. Go to the device, select the Cog menu, Edit, "Misc" tab, then check "Disable ICMP Test?":
If you do want to use SNMP, here is a quick guide for Ubuntu. First install
snmpd:
apt-get install snmpd
Edit the configuration. Remove everything and add the following:
agentAddress udp:161

createUser <username> SHA "<password>" AES "<password2>"

view systemonly included .1.3.6.1.2.1.1
view systemonly included .1.3.6.1.2.1.25.1

rwuser <username>

sysLocation <location>
sysContact  <your name and email>

includeAllDisks 10%

defaultMonitors         yes
linkUpDownNotifications yes
Change username and password to a long and secure name and password (8
characters minimum). Restart snmpd:
service snmpd restart
Add a rule in your firewall to only allow access to UDP port 161 from your monitoring service and deny all other traffic.
You can now add this machine in LibreNMS using SNMPv3 and the authentication data you provided.
Configuring services in LibreNMS
In LibreNMS you should now have a new tab button in the top menu, named "Services":
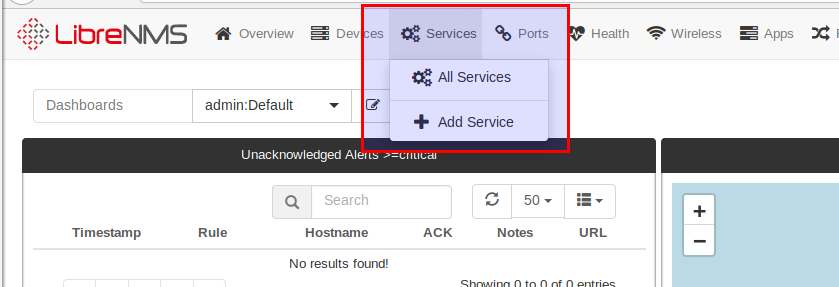
Make sure you added a host as described above. You can navigate to a host and click the "Services" tab, then click "Add service". In the top menu bar you can also click "Services", "Add Service". You then have to select the host as well.
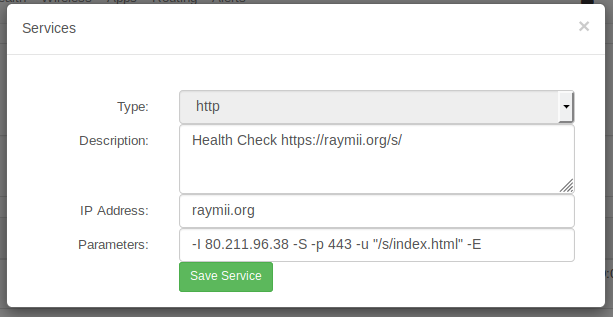
The type is the nagios plugin you want to use. In our case, http (the
check_ part is not shown).
Enter a meaningfull description. For example, "HTTP Check https://example.org/path/to/data".
The IP address can be the hostname or the IP. It is recommended to make this the same as the host the services are coupled to.
The "Parameters" are the Nagios check command parameters, from the shell. In the case of an HTTP check for one of the servers hosting raymii.org it would be:
-E -I 80.211.96.38 -S -p 443 -u "/s/index.html"
IP Address: raymii.org-E: extended performance data-I 80.211.96.38: the specifc IP address (optional, I have multiple A records)-S: use SSL-p 443: use port 443-u "/s/index.html": the URL to request. (optional)
All parameters can be found on the monitoring-plugins website. You can test on the shell first before you add the check to LibreNMS.
Save the dialog box and wait a few minutes for the check to run.
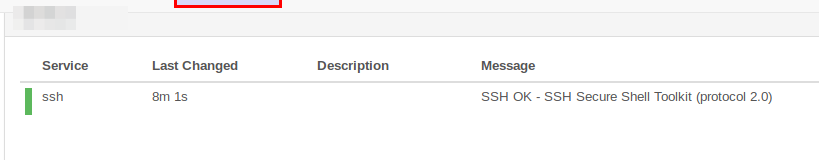
An SSH check is even simpler, just select SSH as the type and add the check.
Here is an example of a Cisco switch where SSH is checked:
A certificate check, to get an alert when a certificate is about to expire, can
also be done. The type is http and the parameters are:
--sni -S -p 443 -C 30
It will check if the certificate expires within 30 days.
Alerting
There is a default alert rule in LibreNMS named Service up/down:
services.service_status != 0 AND macros.device_up = 1
If you want to differentiate between WARNING and CRITICAL Nagios alerts, you can create two rules:
# warning
services.service_status = 1 AND macros.device_up = 1


# critical
services.service_status = 2 AND macros.device_up = 1
Limits
Specific alerting and rechecking when a check fails is not as configurable in Icinga or Nagios. The check will run, and alert you on a failure. Icinga/Nagios allow you to configure escalation paths and advanced re-checking. For example, when a check fails, recheck it 4 times with an interval of X seconds (instead of the regular check interval) and only alert if it still fails.
In Icinga you can define (service or host) groups and apply service checks to these groups. LibreNMS doesn't allow this, so you cannot define a check and apply it to a group. If you need to check 100 servers, it means defining 100 checks by hand per server.
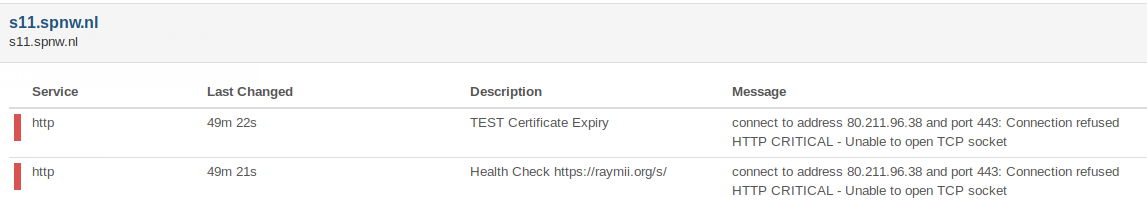
Examples
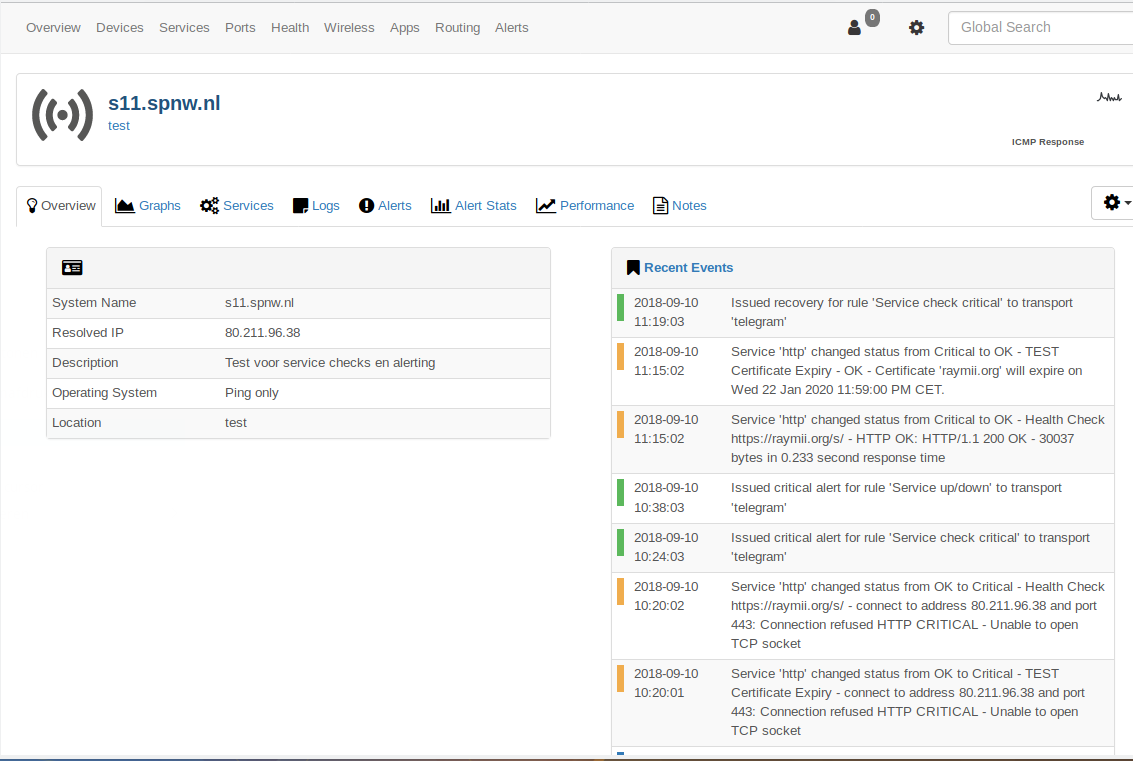
Here is an example of services that are down:
Here is an example of a dummy host (no ICMP or SNMP) with a HTTP check and alerting enabled: