Raymii.org

אֶשָּׂא עֵינַי אֶל־הֶהָרִים מֵאַיִן יָבֹא עֶזְרִֽי׃Home | About | All pages | Cluster Status | RSS Feed
Semi-accurate live stream viewer count (hls/rtmp/restreamer) on the command line
Published: 25-11-2020 | Author: Remy van Elst | Text only version of this article
❗ This post is over five years old. It may no longer be up to date. Opinions may have changed.
Table of Contents
Due to all the working-from-home in the past few months I had to setup a live stream. At first the stream went directly to YouTube, but after they've screwed up multiple times, we decided to not be dependent on them. Using restreamer, a piece of open source software to live stream both to your own server and to another (YouTube) at the same time, we have more control over the stream and are not surprised by YouTube doing stupid stuff unannounced.
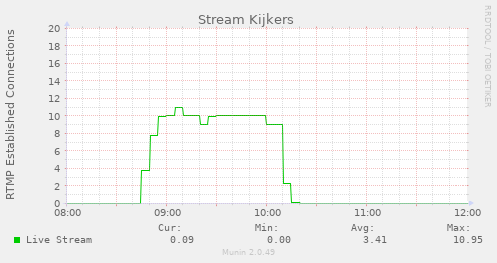
Restreamer provides a simple web player that works on all major platforms and streams to YouTube, but one thing it lacks is a live viewer count. That's a hard problem to solve correctly and accurately, in this article I'll show you how to do it semi-accurately via multiple ways, including graphs like this:
This article contains a rant on YouTube breaking stuff and the commands used to get a live viewer count.
Do note that this article is about the open source Restreamer software, not the paid for restreamer.io website. I did contribute to restreamer since it's such a great piece of software.
A rant on YouTube and Google
First a new version of YouTube live was released, resetting our stream key, without notifications. Now they also require you to open the live control room web page, otherwise your stream won't start, again, without any notification or help. The live stream is quite critical due to a limit on how many people can physically be on location.
The workflow was simple before, click the button "Start Streaming" in OBS. Now it involves logging in to an account with 2 factor authentication, opening up a web page, getting a few dialogs on title and options, then clicking start in OBS and checking if everything on YouTube works. Way more error-prone and more ways to, by accident, make mistakes.
Using Restreamer, we have more control over the live stream. It's on our own server, [a $5 droplet at Digital Ocean][99], which can easily support 120 concurrent viewers with a 5 mbit stream.
We don't want to break existing work flows for our viewers (as opposed to what Google does), so we stream to YouTube as well (via restreamer). For the people that are used to YouTube, they can keep watching as they're used to. But, if for whatever reason, something breaks, our own server and stream are available. Continuity is guaranteed even with the incoherent stupidity and breaking changes of YouTube.
Now we have that rant out of the way, lets continue on with something productive for which you came here, measuring live stream view count.
Measuring live viewers?
First and foremost, there is a feature request over at Restreamer to implement a viewer count, so be sure to check that issue as it might be more up to date than this page.
There are multiple ways to measure viewers, with different levels of privacy invasion and accuracy. You can use Google Analytics, write some custom javascript with a unique id and track that page, use log analysis, bandwidth interpolation or count established connections.
We ended up using connection measurement and bandwidth interpolation because that is accurate enough for our use case. I'll not cover the custom javascript option, only Google Analytics, bandwidth interpolation and connection counting.
All of our analytics show that we had about 13 viewers on the live stream, with 9 that watched almost the entire stream and 4 that watched a bit.
Google Analytics in Clappr
The the most accurate measurement in my experience is to use Google analytics with the clappr web player, which gives you a count of every event, start, stop, pause, etc:
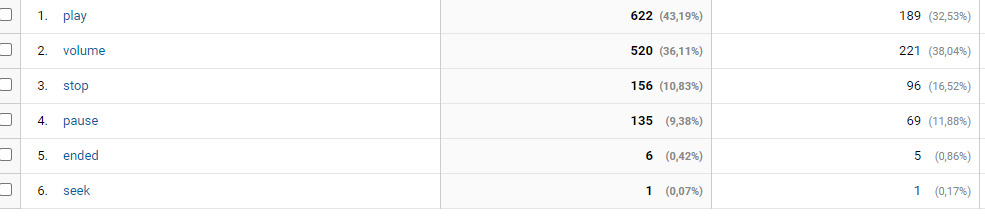
(This graph is from a friend of mine with a larger live stream audience)
However, this is very privacy invasive, sends all that sweet data to Google and allow you to track every event back to a single person inside the analytics console. Although the measurements were the most accurate, we decided it was to privacy invasive for our intended goal.
Bandwidth interpolation
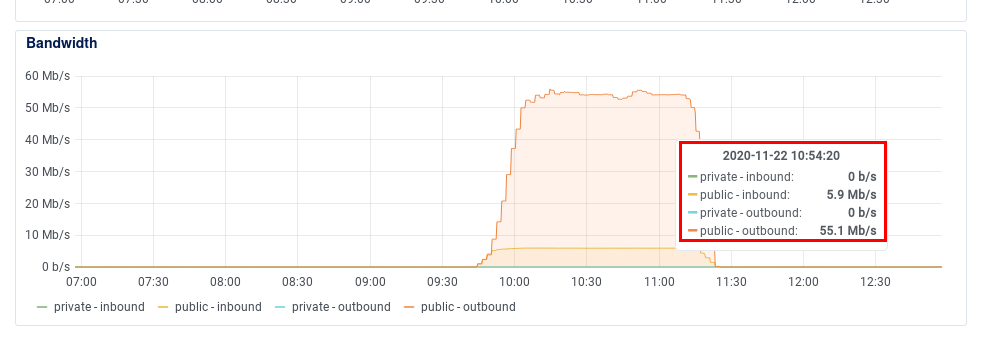
Our stream has a set bitrate of 5 mbit. Restreamer does not do encoding, so every 5 mbit out in that time should correspond to one stream viewer. Using the graphs [Digital Ocean][99] provides, we can do a simple division:
55 mbit out / 5 mbit in = 11 viewers
Here is the graph of Digital Ocean:
If your provider does not provide such graphs, you can use your own monitoring
tools, like the command line vnstat utility:
vnstat --top10 --style 1
Output:
 eth0  /  top 10

   #      day          rx      |     tx      |    total
-------------------------------+-------------+---------------------------------
   1   11/15/20       3.38 GiB |   35.21 GiB |   38.58 GiB  %%::::::::::::::::
   2   11/22/20       3.82 GiB |   30.89 GiB |   34.71 GiB  %%::::::::::::::
   3   10/18/20       6.54 GiB |   17.61 GiB |   24.15 GiB  %%%::::::::
   4   11/01/20       3.48 GiB |    3.68 GiB |    7.17 GiB  %::
   5   10/16/20       1.82 GiB |    2.31 GiB |    4.13 GiB  :
   6   10/28/20       2.03 GiB |    2.03 GiB |    4.07 GiB  %
   7   11/08/20       1.14 GiB |    2.82 GiB |    3.96 GiB  :
   8   10/15/20       1.38 GiB |  891.15 MiB |    2.26 GiB  %
   9   10/14/20     857.32 MiB |    1.37 GiB |    2.21 GiB  :
  10   11/12/20     686.86 MiB |    1.09 GiB |    1.76 GiB
-------------------------------+-------------+---------------------------------
5 mbit/s for 90 minutes in gigabyte is 27 Gb (gigabit), is 3.375 GB (gigabytes) for one full time stream viewer. 30.89 GB / 3.375 GB equals 9.15 full time viewers. Not everyone watches the full length stream, as you can see on the graph as well.
Log analytics
In the web server log we can check how many IP's connected to the .m3u8 file (the stream)
during the time we want to analyze. A tool like goacces can give you a visual overview,
in the below picture you can see every visitor sorted by traffic, 7 on this page and 2 on the next
page have downloaded over 2 GB of traffic, we can safely assume that are stream viewers,
giving us 9 viewers and 2 that watched half the stream according to the amount of traffic.
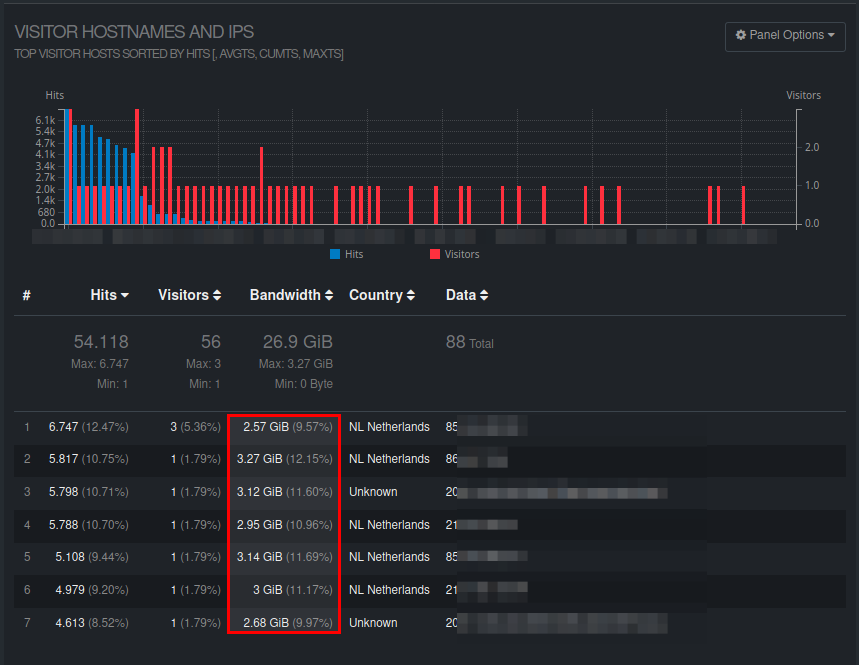
The picture was filtered by date and by the filename of the stream live.m3u8.
On the command line you can use a bit of awk to sum up all traffic for requests
per IP.
zcat /var/log/nginx/access.log.3.gz | \
awk ' { total[$1] += $10 } \
END {  for (x in total) { printf "%s : %9.2f Mb\n", x, total[x]/1024/1024 } } ' | sort -k2
Output:
86..... :    748.54 Mb
84......:   1438.23 Mb
86......:   2560.98 Mb
85......:   2634.83 Mb
2001:...:   2745.76 Mb
86..... :   2827.64 Mb
212.... :   3018.51 Mb
212.... :   3076.66 Mb
2001:...:   3196.46 Mb
85..... :   3220.37 Mb
86......:   3347.41 Mb
(I've filtered out the IP addresses but you get the gist)
In the NCSA log format (what nginx and Apache use) the first item is the visiting IP (or hostname) and the tenth item is the amount of bytes that request took.
Using awk we count up each request amount of bytes for the IP ({ total[$1] +=
$10 }), then print that divided back to Mb (END { for (x in total) {
printf "%s....), sorting by column 2 (sort -k2).
Here we can see 9 full stream viewers and two that watched for a bit. By adding
a few grep commands you can filter some more on the input, for example,
on status code (grep ' 200 ') or split up the user agents.
Measuring established connections
In this article I described how you can measure the amount of established connections. HTTP normally does not work very well with this technique since they are not long running connections. HLS however, is a longer running connection, since segments of the stream are downloaded, which in turn counts as a long established connection for my way of measuring.
Using the following command we can get a count of currently established connections to port 443 (which is an nginx reverse proxy in front of restreamer).
ss --all --numeric --no-header state established '( sport = :443 )' | wc -l
However, that also gets you the one off HTTP hits that might be established on that exact second you execute the command. Not super accurate, most often giving almost double the amount that I expected were watching the stream.
But since we're on the command line, we have another tool to the rescue.
You're probably familiar with diff, a command that shows the differences
between to files. In this case we need the exact opposite of that, I want to
execute the command twice and see which IP's are still here, they are probably
watching the stream.
You might not expect it, but the tool to do that is named comm. It finds the
lines that are the same in two files (as opposed to diff).
The last command line trick up my sleeve is to surround a command with a less then sign and parentheses to get it's output directly into a temp file, like so:
<(command)
echo <(w)
Output:
/dev/fd/63
Combining all that into one large line, filtering out everything except for
the IP addresses from ss, sleeping 5 seconds and then executing the same
ss command again, into comm with a line count at the end results in this
line:
comm -1 -2 <(ss --all --numeric --no-header state established '( sport = :443 )' | awk '{print $5}' | awk -F: 'NF{--NF};1') <(sleep 5; ss --all --numeric --no-header state established '( sport = :443 )' | awk '{print $5}' | awk -F: 'NF{--NF};1') | wc -l
We can put this into a munin plugin (at the end of this page is the code) to graph it automatically every minute, giving us the result over time, here is that graph zoomed in on the stream time:
Also, 9 viewers.
If you don't want to use munin for graphs, you can put this on watch to get
a live count during your stream:
watch comm -1 -2 <(ss --all --numeric --no-header state established '( sport = :443 )' | awk '{print $5}' | awk -F: 'NF{--NF};1' ) <(sleep 5; ss --all --numeric --no-header state established '( sport = :443 )' | awk '{print $5}' | awk -F: 'NF{--NF};1' ) | wc -l
Conclusion
Measuring live viewers without sending all their data to Google and thus being very privacy invasive is hard. In this article I've shown you a few ways to get reasonably accurate measurements using tools on the linux command line. All of them agreed on the amount of viewers but do require manual interpretation. Not a bad thing, but not as magical and automatic as just a counter on a web page that handles it for you.
Munin plugin
For your convenience, here is the munin plugin I use for the graphs shown in this article.
cat /etc/munin/plugins/hls-long.sh
Output:
#!/bin/bash
# -*- bash -*-

: << =cut

=head1 NAME

HLSStreamViewers - Plugin to measure stream viewers

=head1 NOTES

Service usage and uptime under your control.

=head1 AUTHOR

Contributed by Remy van Elst

=head1 LICENSE

GPLv2

=head1 MAGIC MARKERS

 #%# family=auto
 #%# capabilities=autoconf

=cut

. $MUNIN_LIBDIR/plugins/plugin.sh

if [ "$1" = "autoconf" ]; then
        echo yes
        exit 0
fi
if [ "$1" = "config" ]; then

        echo 'graph_title Stream Viewers'
        echo 'graph_args --base 1000 -l 0 '
        echo 'graph_scale no'
        echo 'graph_vlabel HTTP Established Connections > 5 sec'
        echo 'graph_category stream'
        echo 'v1.label Connections'
        exit 0
fi

echo "v1.value  $(comm -1 -2 <(ss --all --numeric --no-header state established  '( sport = :443 )' | awk '{print $5}' | awk -F:  'NF{--NF};1') <(sleep 5; ss --all --numeric --no-header state established  '( sport = :443 )' | awk '{print $5}' | awk -F:  'NF{--NF};1') | wc -l)"