Raymii.org

אֶשָּׂא עֵינַי אֶל־הֶהָרִים מֵאַיִן יָבֹא עֶזְרִֽי׃Home | About | All pages | Cluster Status | RSS Feed
Get serial port data on the web with live updating
Published: 28-09-2019 | Author: Remy van Elst | Text only version of this article
❗ This post is over six years old. It may no longer be up to date. Opinions may have changed.
Table of Contents
Recently I was asked to build a test setup to measure the accuracy of a few loadcells (weight sensors) in a frame. Someone other than me would execute the test and required access to the measured data, preferably live and without needing knowledge of ssh or linux. The weight sensors can be read with an openscale board from sparkfun via a serial connection which the board emulates over USB (via an FTDI chip), via that same serial connection you can also calibrate them or change settings like amount of decimals. As a quick solution I created a webpage that uses a small amount of javascript to live update the readings from the board. screen is used to capture the output of the serial connection to a file which the webpage displays and updates. In this article I'll talk about how I put various bits of software together to get the output of the serial connection onto a nice webpage with live updating.
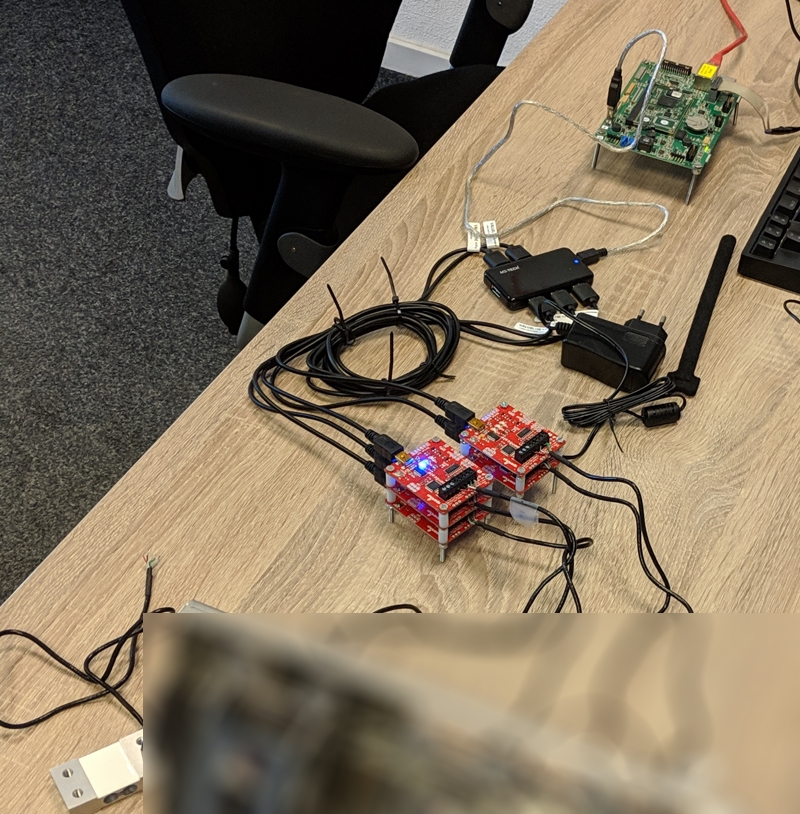
The picture above shows the hardware setup. The blurred part is the actual hardware part with the load cells in it. You can see one cell on the left. The red boards are the Sparkfun Openscale boards, connected via a USB hub to a Variscite VAR-SOM-MX6 board running Yocto Linux (openembedded). I built a webserver package for the board (nginx) since normally it runs nothing except the main application.
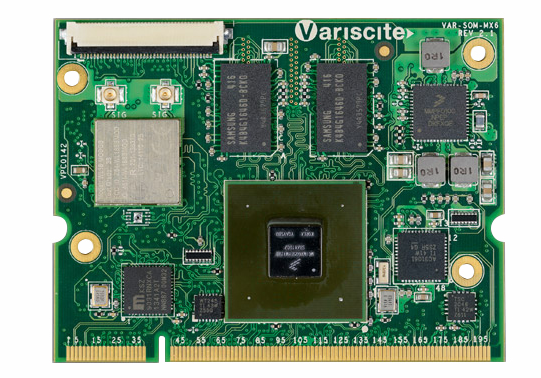
The choice for this linux board was just because that was available. It could just as well be a regular PC or Raspberry Pi, anything that can run screen and a webserver.
The tests themselves will be done by someone else, who can navigate to a webpage to check the current readings. Below is a screenshot of the webpage:
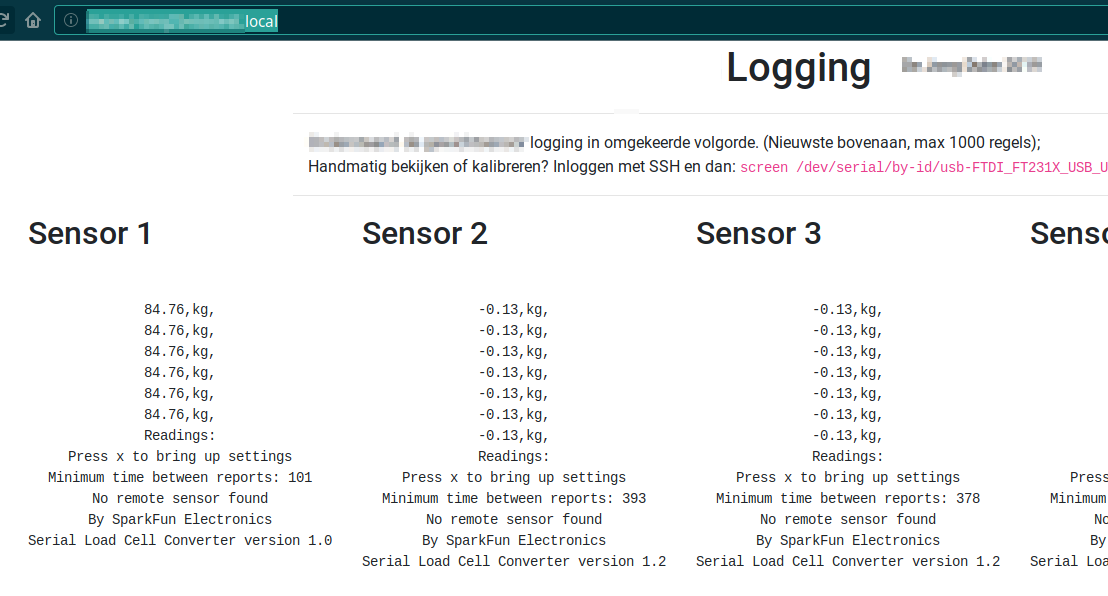
If the test results are good enough, those load cells might be used in the future, but not with the sparkfun openscale boards. The cells will then just be connected to the regular machine and we'll write our own software to use the sensors.
Hardware setup
The hardware I used consisted of common off the shelf parts:
- 5 Sparkfun OpenScale boards
- 5 Double-ended beam load cells
- 6 port USB hub
- Linux board to connect it all up (could be a Raspberry Pi)
Connecting it all is not a hard job either:
- Screw in the load cells on the desired places.
- Wire them into the screw terminal on the sparkfun board
- Connect the sparkfun boards to the USB hub
- Connect the USB hub to the linux computer
I didn't require a powered USB hub since the linux board itself gave enough power but your results can vary. Try less sensors or a powered USB hub if the serial connection is flaky.
Software setup
This is where stuff gets interesting. The goal of this setup was to be easy for a non linux user to use. Someone who will test the accuracy of the sensors, what happens when you do X, how does the setup respons when Y happens, etc. That person is not interested in the software side of things, they just require the measurements.
The time I got allocated to build this was not much, that's why this setup is so simple. With more time, I might have added graphs, log archiving or a piece of custom software to read the sensors without the sparkfun board. But, it had to be done quickly, which required me to think about what tools were at hand for this job.
The essential thing the setup needed to do was to provide log data in an easily accessible format. During testing you don't want to click five times or type commands, you just want to test. The setup should provide that.
The sparkfun openscale boards barf their output right on the (emulated) serial port. What if we could present that data on a webpage so that the tester just needed a laptop or tablet during their testing. What if we could make that data live update using modern fancy web techniques? (Remember I'm doing embedded C, not javascript).
screen
Screen is a linux terminal multiplexer. You can have one terminal and use screen to get more. Handy when you're doing work via SSH, you can reconnect to the screen session and continue on if for whatever reason the connection dropped. Or you can run your IRC client, it won't disconnect when you log off.
As a byproduct of earlier times you can also connect to a serial port. Handy for
sending AT commands to your modem or connecting to your actual physical
terminal. We're going to use that to connect to the USB serial device in the
sparkfun board.
Screen supports logging of the session to a text file and allows you to insert timestamps in that log. Perfect for what we want. That log can then be read out via the webpage we're creating later on.
Start screen with the following commandline options:
screen -dmS sensor1 -L -Logfile sensor1.txt
/dev/serial/by-id/usb-FTDI_FT231X_USB_UART_XXXX
Replace the actual serial device by the path to your device. The sparkfun board all have a unique serial number, so I can match them to the actual sensors.
-dmS: start screen in detached mode and name this sessionsensor1-L: log the output to a file-Logfile: change the filename of the log from the default tosensor1.txt
The output of the sensor will now be in text file sensor1.txt. If you use
tail -f sensor1.txt you'll notice that it only updates every 10 seconds,
whereas the openscale board outputs every 2 seconds. Luck has it that screen
allows you to set the flush rate of the log. You can either use a .screenrc
file, or send it to the running session as a screen command. My compiled version
of screen has some quirks due to it being an older version, so I cannot use the
.screenrc route. Using the -X option I can send a command to a running
screen session.
Note that this is not a shell command that will be executed, it is a screen
command. One you could also give inside the running screen session by pressing
CTRL+A : (colon).
The command to set the flush rate is: logfile flush seconds, replacing
seconds by the number of seconds.
To send it to a running screen session, in my case, sensor1, use the following
command:
screen -S sensor1 -X logfile flush 2
No quotes around the options. If you tail again, you'll see the file being
updated every 2 seconds.
I put a construction like this in a shell script for all 5 sensors, the script
is autostarting at boot of the linux machine via systemd. That means that all
sensors will be logged to a file named sensorX.txt where X is the sensor
number.
With the logging of the serial port data set up we can continue on to create the webpage.
Fancy pancy javascript webpage
As you might have guessed from the section heading, I don't code javascript
often. My piece of cake is C++ and C for small embedded platforms. If the code
looks simple to you then that's the reason. No frameworks, no nodejs, heck, if
I could get away with a <meta http-equiv="refresh" content="2"> I'd use that.
But, modern day users expect more than that, so why not.
The code you'll see below uses bootstrap css for styling. Hosted bootstrap that is, just because I'm lazy.
The javascript part is split up into two parts. One is to actually do the XHR
(ajax) request on a file and update the DOM (replace the current contents of an
html element with the new content) and one is to reload the five files using
that first function. The automagic reloading is set with a timer via a
setInterval.
The first function to reload the data:
function reloadData(url, html_id)
{
    var req = new XMLHttpRequest();
    var now = new Date();
    req.open("GET", url + "?" + now.getTime(), false);
    req.onreadystatechange = function ()
    {
        if(req.readyState === 4)
        {
            if(req.status === 200 || req.status == 0)
            {
                 dataDiv = document.getElementById(html_id);
                 dataDiv.innerHTML = req.responseText.split("\n").reverse().slice(0, 1000).join("\n");

            }
        }
    }
    req.send(null);
}
The function accepts an URL and a HTML element ID to replace. A timestamp is
appended to every request so that it is not cached by the browser. If the
request fails, nothing happens. The .onreadystatechange contains the function
we want to execute every time the readyState attribute changes of the request.
There is no filtering or escaping of contents, the html attribute is blatantly replaced.
In the status files the data is set with the newest lines on the bottom. For the webpage, I want those on top, since you're not scrolling when doing the testing. You just want to look. Therefore, the file line order is reversed with this bit:
.split("\n").reverse().slice(0, 1000).join("\n");
It also limits the log to at max 1000 entries. Not a great seperation of concerns, but for this stage, workable.
The second part is a wrapper function to call the reloadData on the five files
we want:
function reloadFiles()
{
    reloadData("sensor1.txt", "sensor1");
    reloadData("sensor2.txt", "sensor2");
    reloadData("sensor3.txt", "sensor3");
    reloadData("sensor4.txt", "sensor4");
    reloadData("sensor5.txt", "sensor5");
}
The last part is this:
setInterval(reloadFiles, 1000);
Which will execute the wrapper function every second.
The HTML part of the page contains some styling and columns for a header, the actual data is put in four of these blocks:
<div class="col-md-auto">
  <h2>Sensor 1</h2>
  <pre>
    <div id="sensor1" align="center">
      <p>Loading Sensor 1 Data...</p>
    </div>
  </pre>
</div>
The text Loading Sensor 1 Data... will disappear the first time the function succeeds.
Bare-bones javascript that gets the job done. Maybe not the best, but this whole setup was put together in two hours and that includes wiring up all the hardware, which took most of the time.
Tags: arduino , arm , blog , embedded , ftdi , hardware , javascript , logging , openscale , screen , serial , tty